Data Summarization in Python
Mar 20, 2016
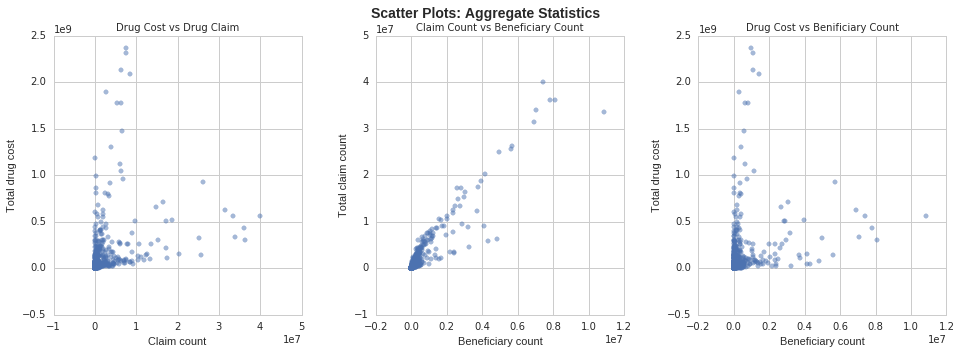
In this example I show how python can be used for various data summarization and data visualization tasks using a few essential libraries such as pandas, ggplot, seaborn, and matplotlib. In the following notebook we will use these libraries to compute some summary statistics on data from the Centers for Medicare and Medicaid Services (CMS). Specifically, we will look at top drugs by total spend, total number of claims and total number of beneficiaries. We will the visualizing our results using seaborn, ggplot, and matplotlib.

Information Retrieval using Naive Bayes
Mar 19, 2016
Naive Bayes Classifiers have been used historically for document classification (i.e. spam detection). They belong to a class of probablistic classifiers and are considered 'naive' due to their assumption of independence between features. Naive Bayes works by taking a set of features and computing the joint conditional probability of these features over as set of labels, P(features|label). It then uses Bayes theorem to return the lable with the largest probabiltiy conditioned on the feature set, P(lable|features).
In this notebook we will implement a Bayes classifier using R and use it to return documents given a query, it can also be used to determine author attribution. For example, given an unlabeled text, return a list of possible authors. Additionally, it may be possible to use this method to determine which journal a particular abstract should be submitted.

Automated Readability Index
Mar 8, 2016
The Automated Readability Index (ARI)is a measure that is used to estimate the reading level required to understand a text. Using average word length, and average sentence length, the ARI returns the estimated grade level of the text. In this notebook we will implement the ARI function and use it to estimate the grade level of several scientific abstracts published in PubMed.
PubMed Authors: Hierarchical Clustering
Mar 4, 2016
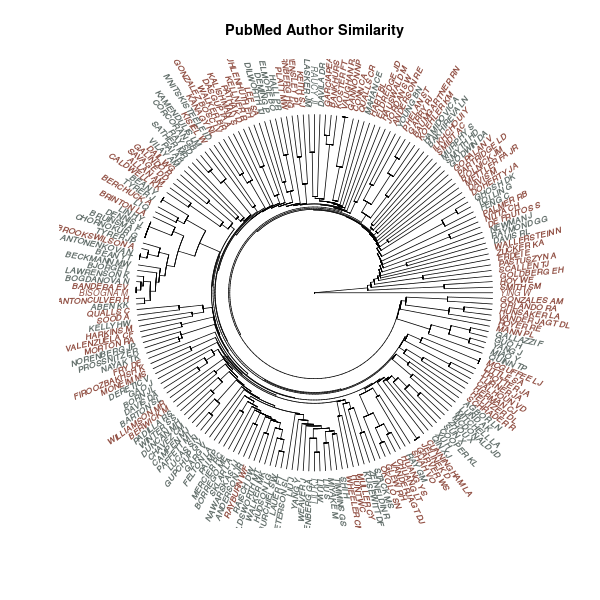
In this notebook we take a look at PubMed authors and how they can be clustered into groups using Term Frequency-Inverse Document Frequency weighted terms extracted from article titles. In particular, we will focus on clustering authors from the University of New Mexico College of Pharmacy and the School of Medicine.

Machine Learning - Python: Document Similarity
Jan 31, 2016
In this notebook we will implement a k-Nearest Neighbors model from sklearn to return similar scientific articles using TF-IDF weights as features. The articles used to create the corpus in this notebook are downloaded from pubmed.gov and restricted to articles submitted by the University of New Mexico College of Pharmacy and the University of New Mexico School of Medicine.
Machine Learning - R: Polynomial Regression
Jan 16, 2016
This post describes the principles of polynomial regression and looks at the bias-variance trade-off for different models of varying complexity.
Machine Learning - R: Simple Multivariable Linear Regression
Jan 10, 2016
This post describes an R implementation of simple, multivariable linear regression in which parameters optimizing Residual Sum of Squares (RSS) are determined using gradient descent.
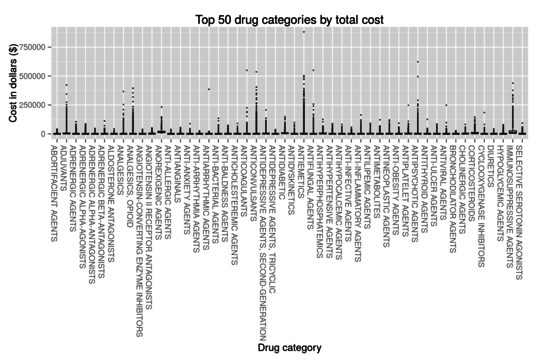
Analysis of Medicare Part D Drug Claims Data
Jan 2, 2016
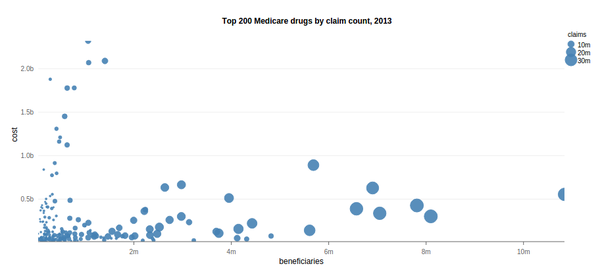
For this project, I was interested in studying drug claims and their associated cost to the Medicare system. This was was done by aggregating the number of claims, beneficiaries and total cost for each of the records listed in the PUF. I then took a subset of the top 200 drugs according to number of claims submitted to Medicare in order to find the most commonly prescribed drugs.
Machine Learning - Python: Simple Linear Regression
Dec 30, 2015
This post describes a python implementation of simple, one-variable linear regression in which parameters optimizing Residual Sum of Squares (RSS) are determined by the closed form method.
Machine Learning - R: Simple Linear Regression
Dec 30, 2015
This post describes an R implementation of simple, one-variable linear regression in which parameters optimizing Residual Sum of Squares (RSS) are determined by the closed form method.

Top 200 Daily drug email list
Nov 15, 2015
Over the last couple of months I've been working with the CMS Medicare Part D dataset in which I've been able to exctact the top 200 most commonly prescribed medications in New Mexico. Using this list and a copy of the DataBank database I was able to create a mailing list that will provide a "drug of the day" email providing drug information for one of the top 200 drugs. To sign-up, visit http://dailydrug.ddns.net and add your email to the list.
Statewide vaccination rates: National Immunization Survey
Aug 13, 2015
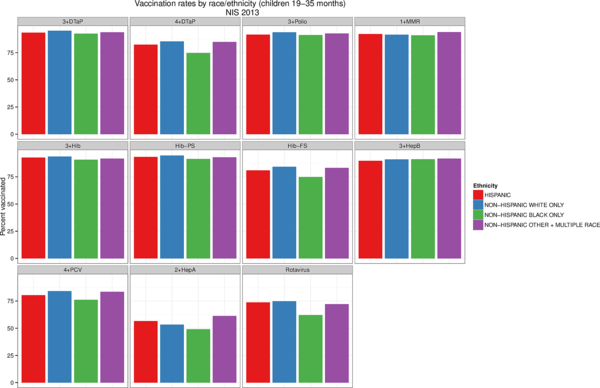
Immunizations are important. They help keep communities safe by preventing the spread of disease. However, to be most effective, a certain percentage of the population must be vaccinated in order to achieve herd immunity. This figure looks at data from the CDC National Immunization Survey to show vaccination rates across the United States.
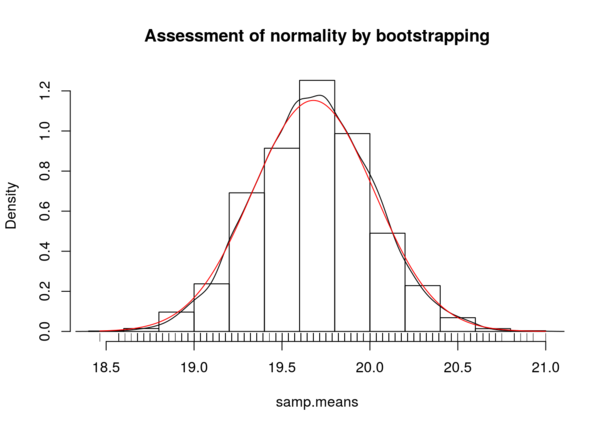
Population inference and hypothesis testing
Jul 5, 2015
How do we use statistics to make inferences from a sample to a larger population? How confident are we that these statistics accurately represent these population parameters and how can we use statistics to test whether or not our observations are different from hypothesized values. These are some of the questions that will be addressed in this article.

Statistical approach to cell detection using Python
Jun 30, 2015
This is a project conducted in Python in which I was interested in counting cells in an image.
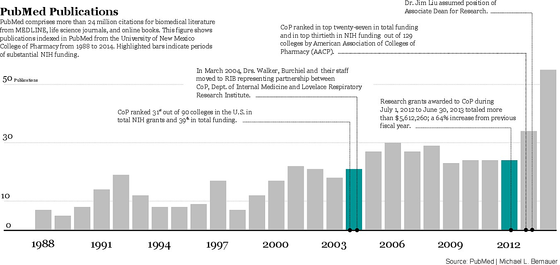
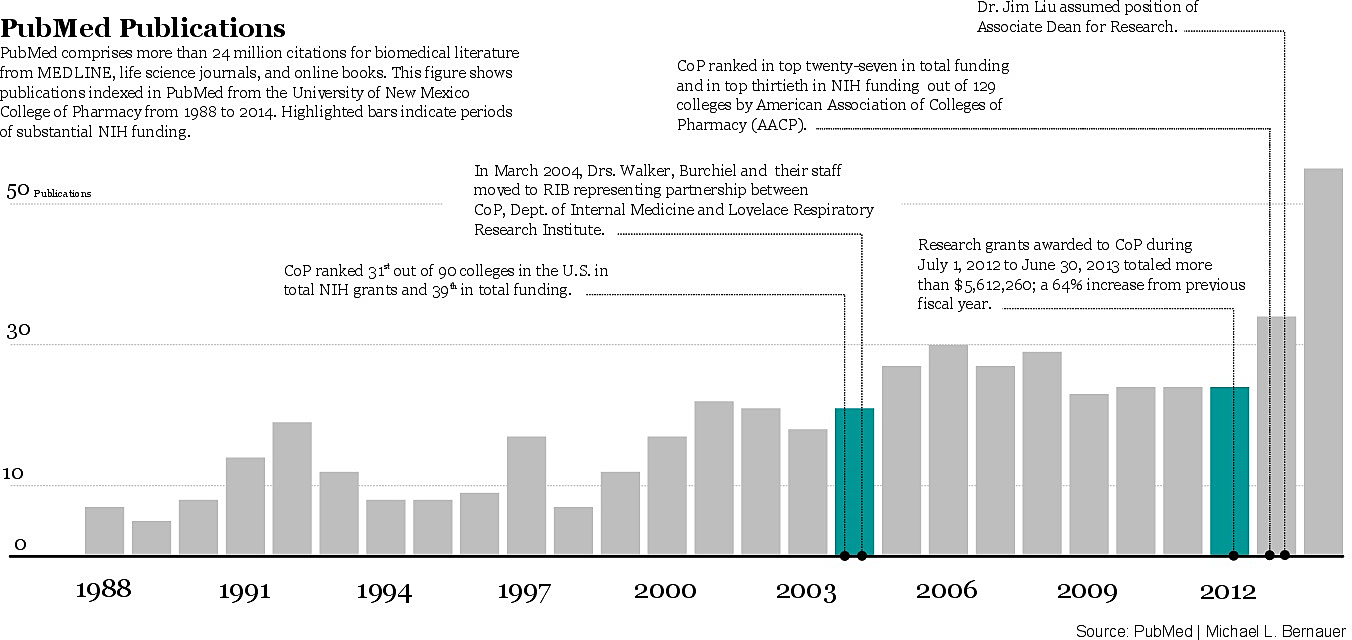
University of New Mexico College of Pharmacy Publication Record
Jun 30, 2015
This figure shows all publications indexed in PubMed beginning from 1988 through December of 2014. Of course this only includes articles that have been indexed in PubMed, so these numbers may not reflect the total number of articles published for that given time.
Analysis of Medicare Part D 2012 data
Jun 8, 2015
This example presents an exploratory analysis of 2012 Medicare Part D data. The data set contains over 21 million rows and was collected from ProPublica.

Pharmacoeconomics: Sensitivity Analysis
Mar 14, 2015
In the example we are interested in computing the incremental cost per life year and the incremental cost per QALY to aid in decision making between two treatment options; Treatment A, and Treatment B. We then conduct a sensitivity analysis to observe how these measures change in response to variations in input parameters; probability of experiencing a particular event and the costs associated with the event.
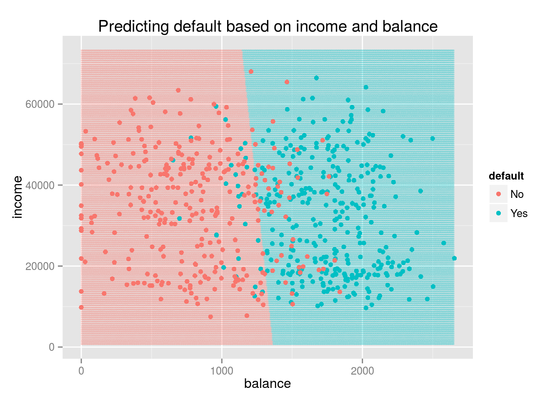
Logistic Regression
Mar 14, 2015
In this exercise we create a binomial logistic regression model to predict whether someone will default on their credit card based on their current credit card balance and income. Once the model is built, we use it to plot the decision boundary for defaulting. Additionally, we see that the overall accuracy of the model is 90%.
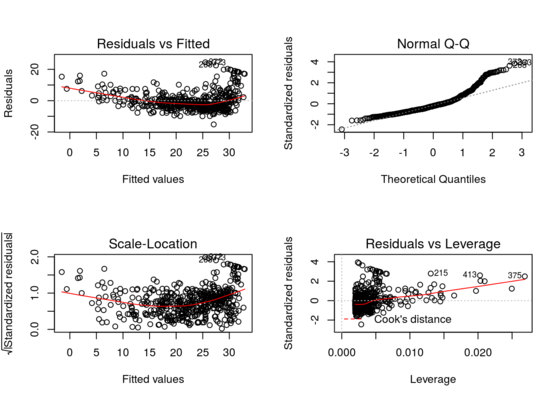
ISLR: Linear Regression
Mar 14, 2015
In this exercise we work the chapter 3 of Introduction to Statistical Learning by Trevor Hastie and colleagues to explore linear regression and how it can be used to predict the median house value of neighborhoods based on the average number of rooms per dwelling, the average age of the house as well as the percentage of houses that qualify as low socioeconomic status.
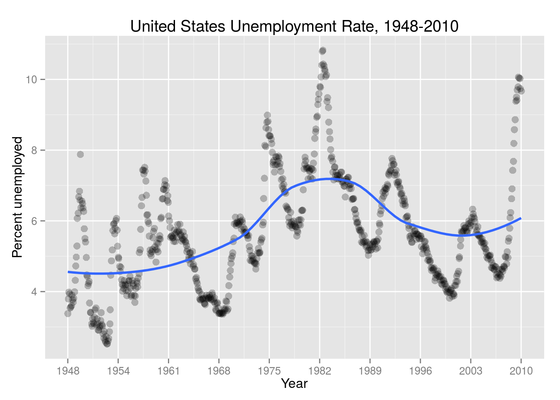
Visualize This: Visualizing patterns over time
Mar 9, 2015
In this exercise we work with data provided by Nathan Yau, author of www.flowingdata.com to visualize trends in United States unemployment data from 1948-2010 using LOESS.
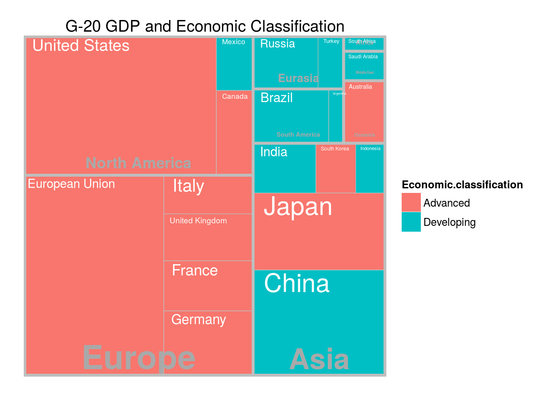
Tree-maps with ggplot2
Mar 9, 2015
In this exercise we learn how to create Treemaps with ggplot2 using the Treeplotify package.
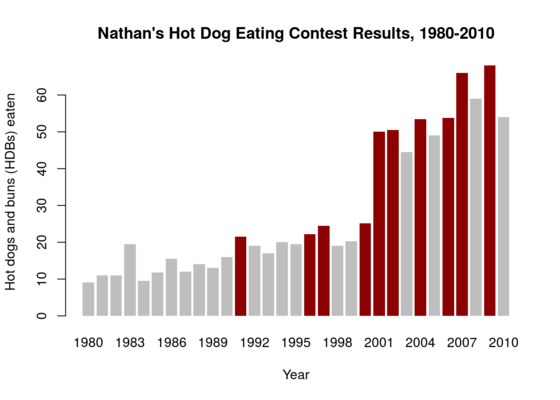
Visualize This: Visualizing patterns over time
Mar 8, 2015
In this exercise we work with data provided by Nathan Yau, author of www.flowingdata.com to visualize the number of hot dogs and buns (HDBs) eaten by contestants of the Nathans hot dot eating competition from 1980-2010.
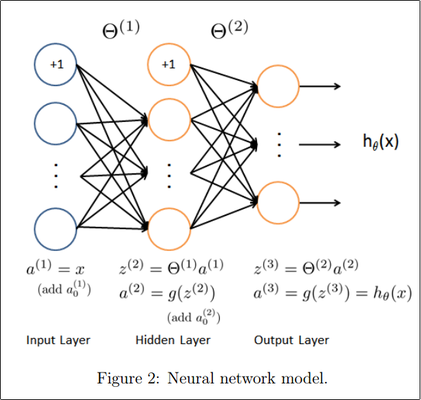
Machine Learning: Multi-class classification with neural networks
Feb 28, 2015
In this post we explore the use of artificial neural networks as multi-class classifiers. In the example provided we will use previously learned parameters to identify handwritten digits using the feed forward algorithm. Neural networks are preferred to the logistic regression methods mentioned in previous posts for these sorts of tasks because they are capable of forming highly complex decision boundaries without the need to train computationally expensive high order models.
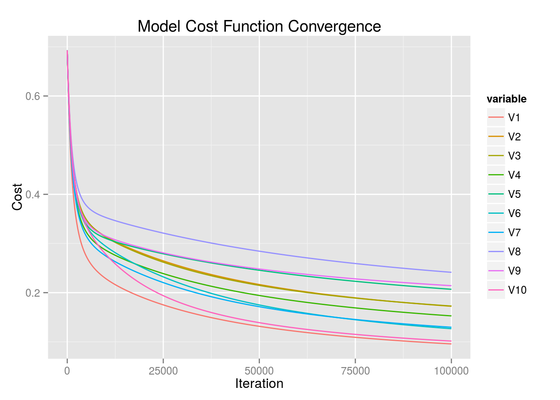
Machine Learning: Multi-class classification with logistic regression
Feb 27, 2015
This exercise implements a one-vs-all linear regression classifier to recognize handwritten digits using gradient descent. Regularized gradient descent was introduced in the post Regularized Logistic Regression. Once trained, the model was able to recognize handwritten digits with an accuracy of 83.8%. It is anticipated that the accuracy could be improved by allowing more complete convergence of the cost function.
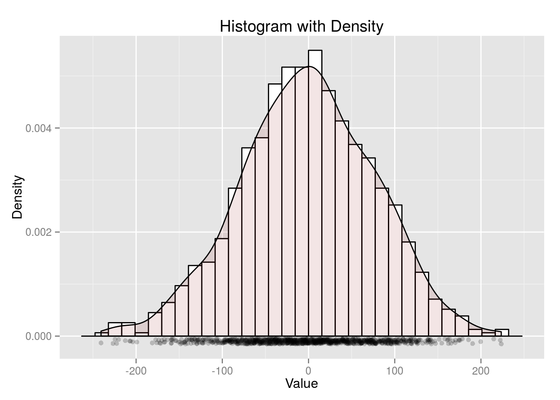
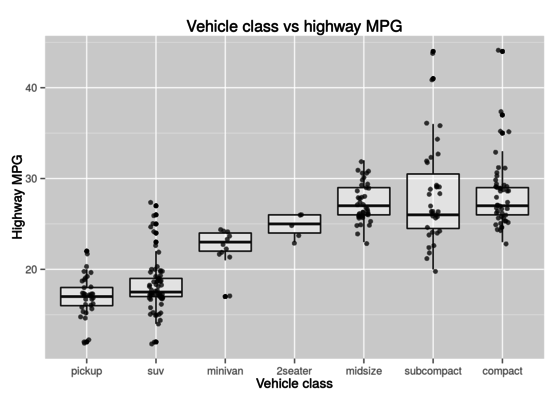
Advanced Data Analysis: Graphical Summaries in R
Feb 26, 2015
This post walks you through a few of the most common plots to graphically summarize data using ggplot2.
Advanced Data Analysis: Introduction to R
Feb 24, 2015
R is an open-source statistical computing language used for a wide range of tasks from data analysis and visualization to machine learning. In this exercise we work through the first chapter of Advanced Data Analysis; a supplemental text to the course STAT 527 - Advanced Data Analysis as taught by Erik Erhardt, PhD at the University of New Mexico. For those of you that are interested in data science I highly recommend taking his course if possible or at least reading through the material posted on his website.
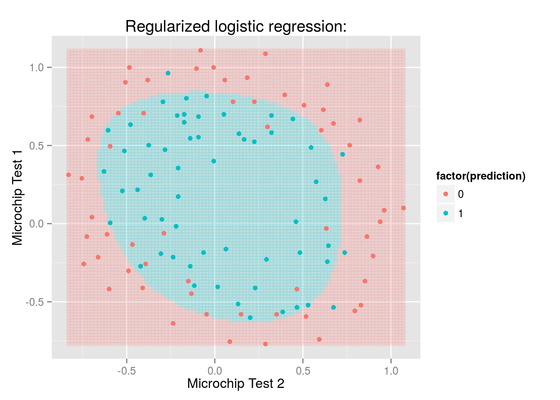
Machine Learning: Regularized Logistic Regression
Feb 21, 2015
In this exercise we will implement regularized logistic regression to predict whether microchips from a fabrication plant passes quality assurance (QA). During QA, each microchip goes through various tests to ensure it is functioning correctly.
Suppose you are the product manager of the factory and you have the test results for some microchips on two different tests. From these two tests, you would like to determine whether the microchips should be accepted or rejected. To help make the decision you have a data set of test results on past microchips, from which can build a logistic regression model.
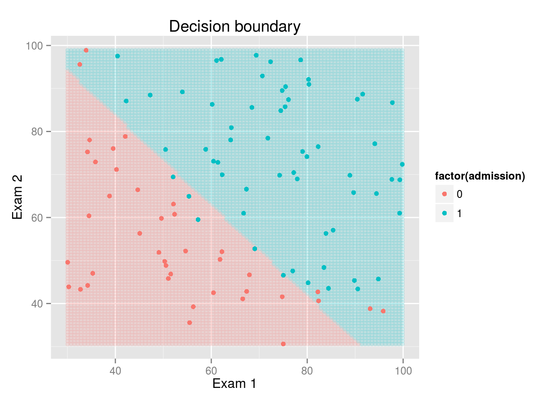
Machine Learning: Logistic Regression
Feb 21, 2015
In this exercise we will build a logistic regression model to predict whether a student gets admitted into a university. Suppose that you are the administrator of a university department and you want to determine each applicants chance of admission based on their results on two exams. We have historical data from previous applicants that will be used as a training set for logistic regression. For each training example, we have the applicants scores on two exams and the admissions decision.
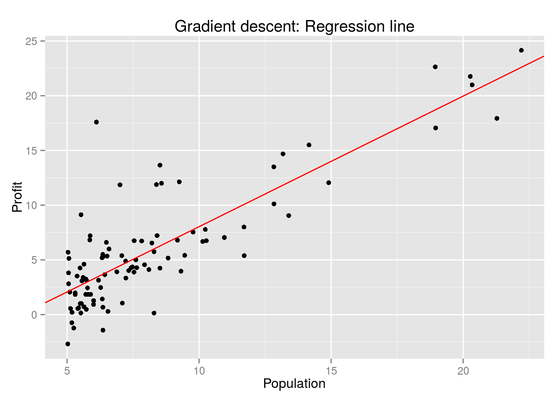
Machine Learning: Linear Regression
Feb 21, 2015
In this exercise we will be implementing linear regression with one variable using the gradient descent algorithm. Given data collected by a food truck we will attempt to predict profit using city population as a predictor.
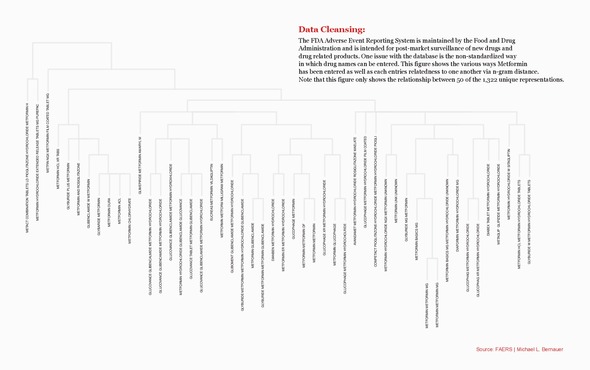
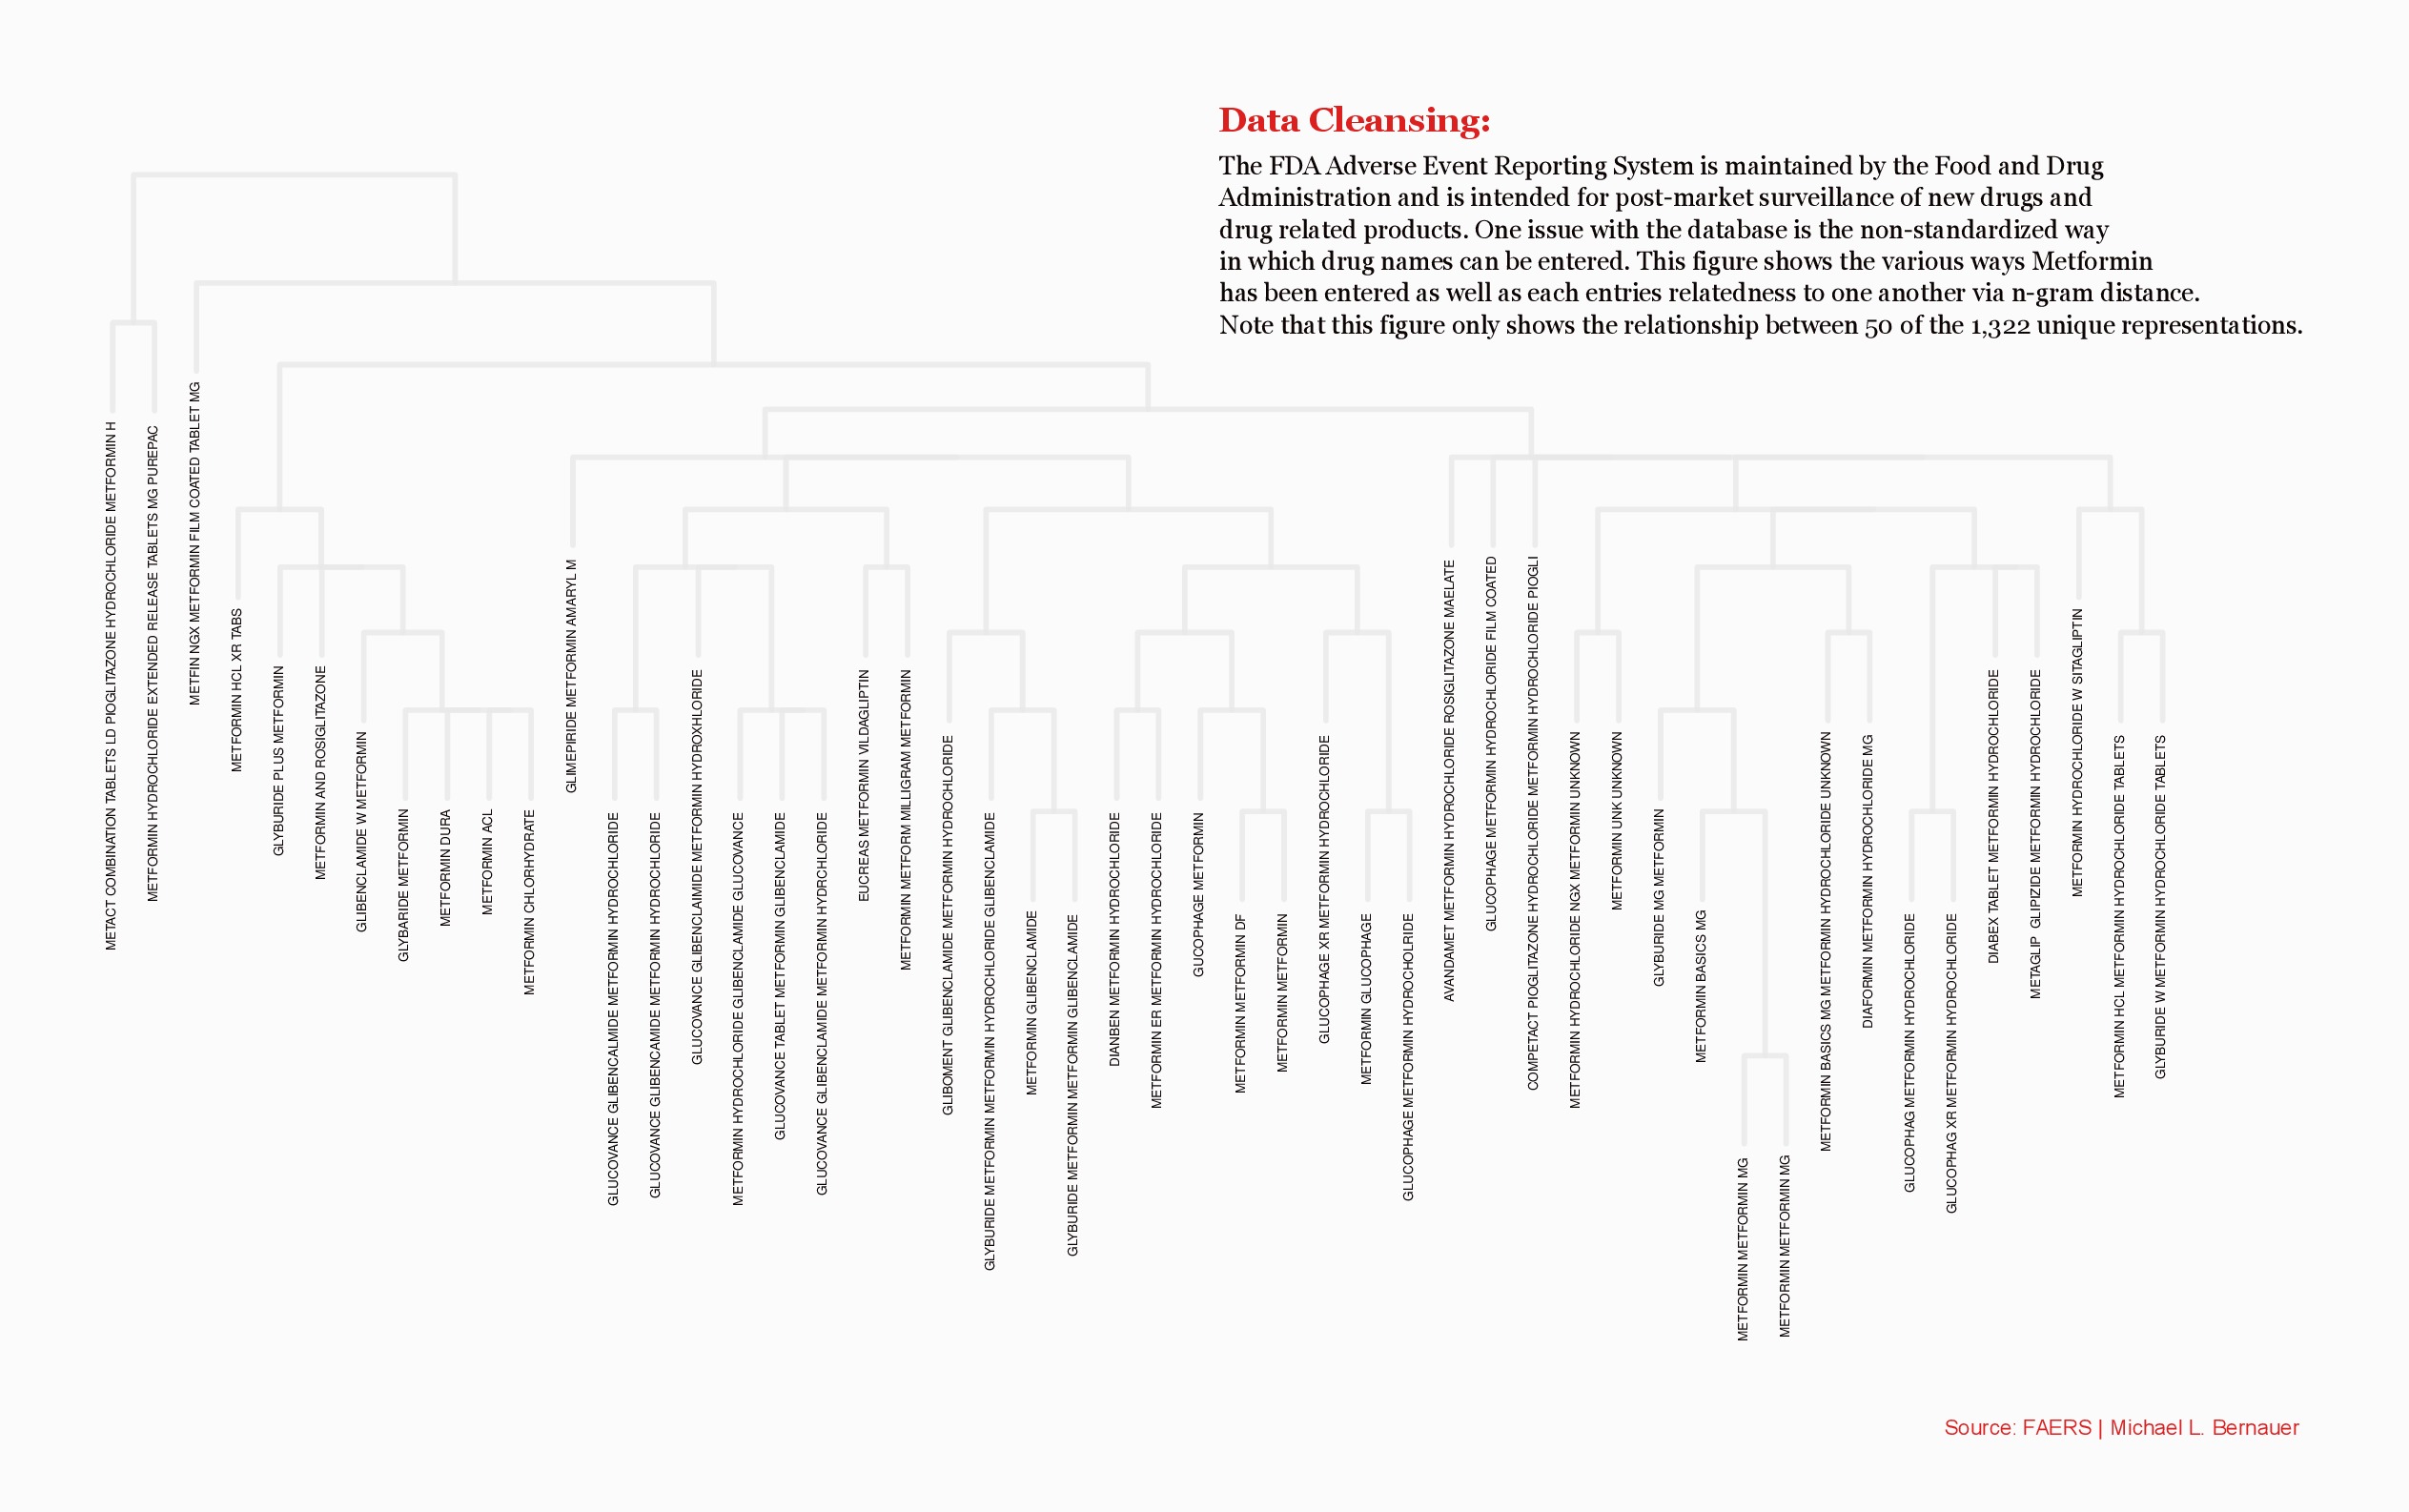
Data Cleansing: FDA Adverse Event Reporting System
Dec 23, 2014
Many data sets are inherently dirty, they contain misspellings, missing data, erroneous values, etc. This is particularly true for data sets created by people typing information into forms or spreadsheets manually. The FDA Adverse Event Reporting System is just that type of data set. Spend just a few minutes browsing the data and you will see that it is rife with errors. For example, consider the drug metformin. In the current database I am working on there are 84,459 different mentions of metformin. By grouping and counting these mentions we can see the top 10 most frequent representations in the table below. More than half of all mentions of metformin are represented as METFORMIN HCL whereas about 24% of the mentions are represented simply as METFORMIN.